I share highlights from our research study published on February 28, 2020. (Scroll for article link.)
What are students trying to do when sketching graphs?
What do students think graphs “should” represent?
What We Did
We conducted a set of three individual interviews with 13 high school students (8 eleventh grade, 5 ninth grade). Students interacted with Desmos “How Graphs Work” Activities, that we developed in collaboration with Dan Meyer and the Desmos team.
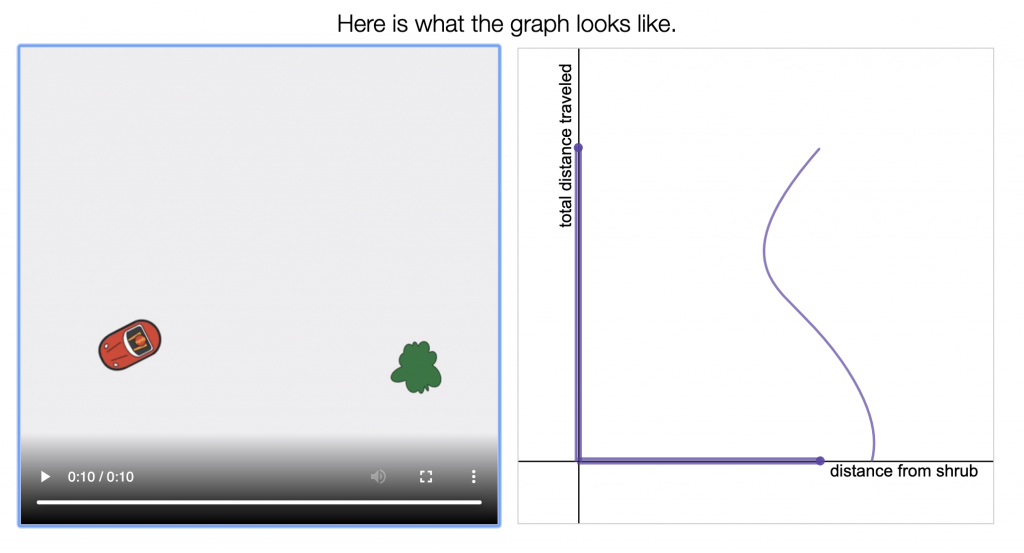
Each graph related different distances, given in an animation. Below is an example of a graph from the Toy Car activity.

We identified three graphing goals, and linked those goals to students’ conceptions of graphs.
- How do I show what I see?
- How many graphs do I need?
- What are the things I am graphing?
What We Found
When working on the Desmos activities, students shifted their goals. We were most successful helping students who started with goal #2, to shift to goal #3.
An additional factor impacted students’ graphing: their notions of what graphs should do. For example, if students thought that graphs should not “squiggle,” it affected their work.
Why This Matters
Graphs represent relationships between attributes. When students wonder what those “things” are, they are well positioned to be critical consumers of graphs.
Sketching accurate graphs is not the only important thing. If students are too focused on sketching something that looks “right,” they may miss the relationships.
As researchers who interview students, our methods are not neutral. Our lenses shape what we see. We need to create space to learn with and from students, who are experts in their own reasoning.