Think back to a time when you encountered a “real world” graph in a math class. What was on the horizontal axis?
Probably TIME.
Graphs represent relationships between two things. When working with graphs, it is important for students to form and interpret relationships between TWO things that can change. Yet, if one of those things is passing time, students might be thinking about only ONE thing changing.
Want to provide students opportunities to think about TWO things that can change?
Have students interpret graphs that represent two changing lengths.
Wonder how to get started?
Try these Ferris Wheel Interactives on NCTM Illuminations.
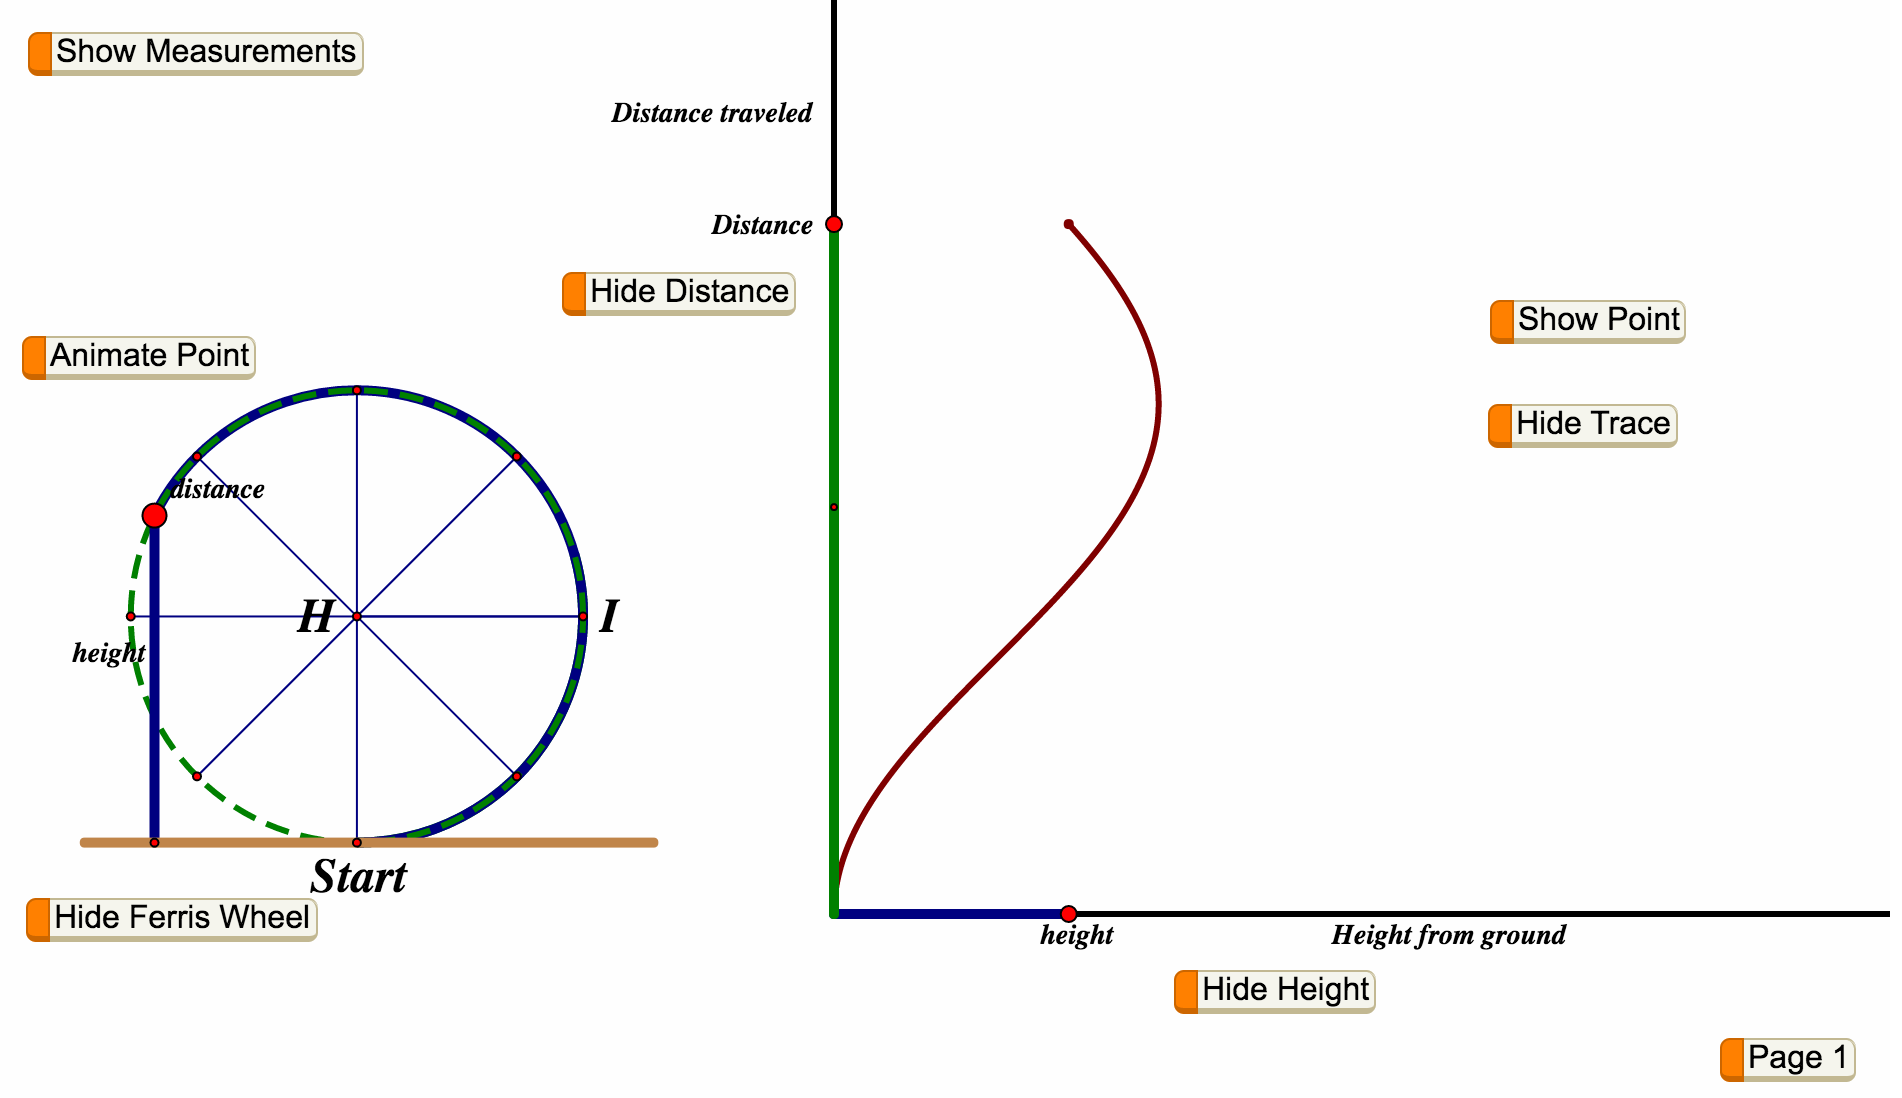
It’s about time that students have opportunities to encounter “real world” graphs representing things other than time.
Nice. I never remember conceptually understanding trig functions in high school (or college for that matter). I wasn’t aware of this resource but I can see how the drawing and graph, together, would really help kids make more sense. Thanks for sharing.
Thank you! I have used these interactives with early algebra students. My goal is to provide students opportunities to make sense of graphs as representing relationships between two things that are possible to measure and capable of varying.