Students have many opportunities to use different types of representations to show the same relationship between variables (e.g., graphs, tables, equations).
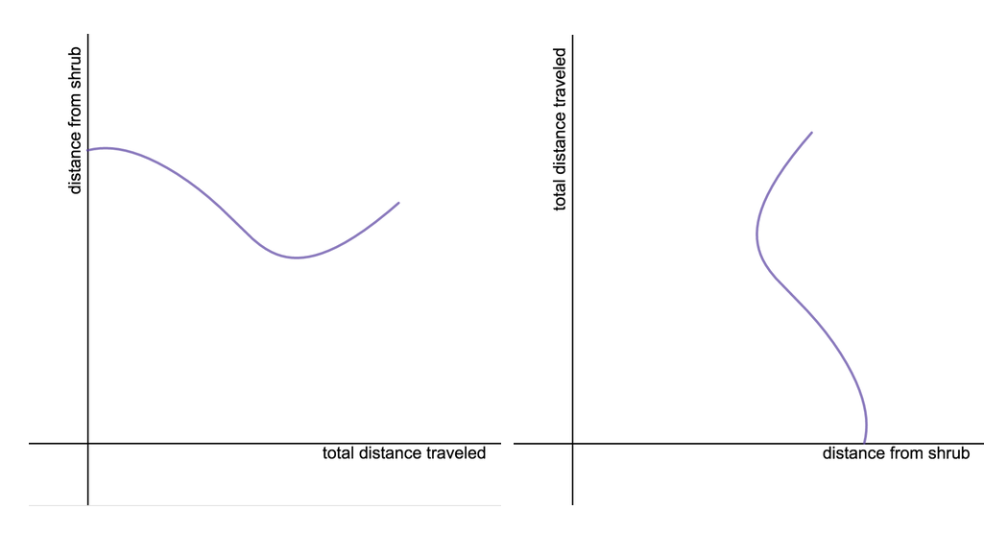
Students also benefit from opportunities to use different forms of the same type of representation (two different looking graphs) to show the same relationship between variables.
Wonder how that can be?
Check out this Desmos Toy Car Activity.
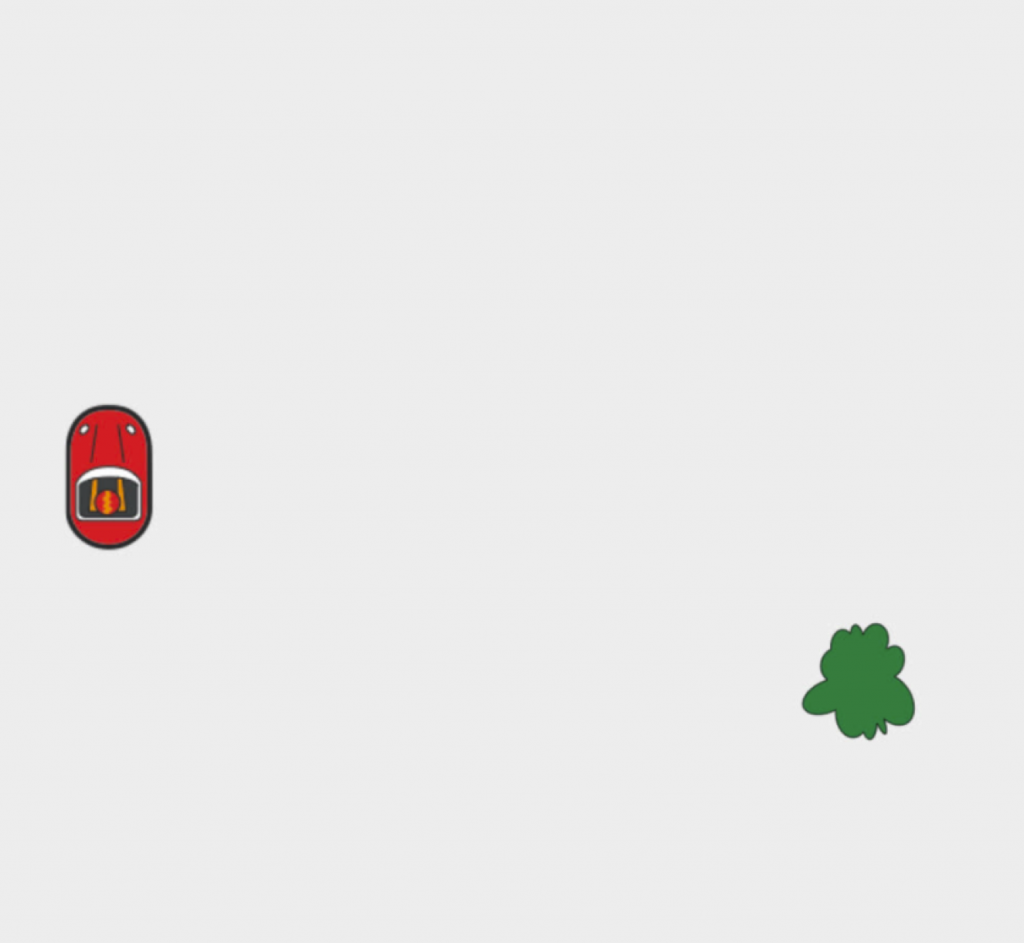
Students explore how each variable changes, then they sketch different graphs to represent the same relationship between variables.
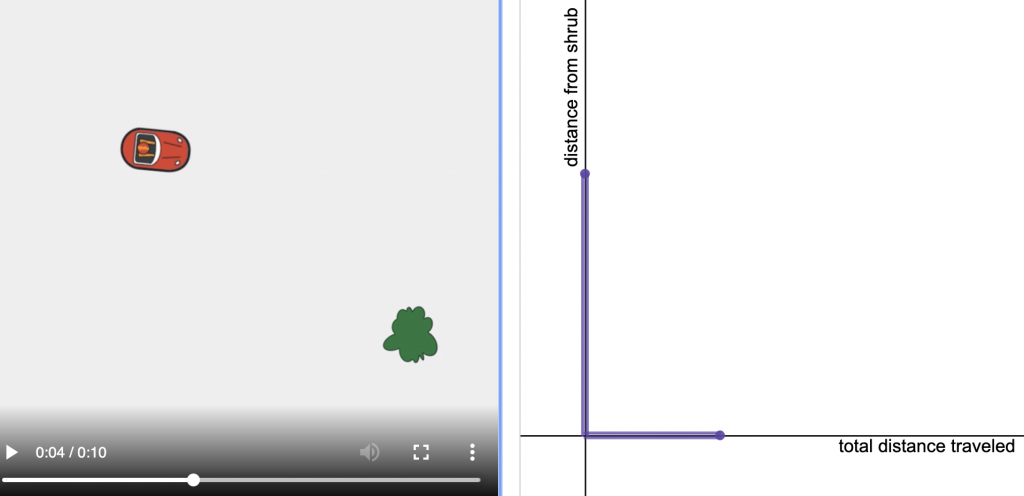
Students might be surprised that the sliders stay on the vertical and horizontal axes. When only one variable is changing, a line is sufficient to represent that change.
Graphs can be more meaningful for students when they understand what the variables are measuring. To begin, ask students how they might measure the toy car’s total distance traveled and the toy car’s total distance from the shrub.
Students’ reasoning is more important than the accuracy of their graphs. Encourage students to question, explore, and discover!
The work in your tectivities is PROOF of why college algebra is a meaningful standalone class, not just a “remediation station” for calculus. I keep hoping to push fast forward and see the studies of how these transformed courses and the student mathematicians in them end up at the culmination of their math journeys. This activity is so rich!